Climate and groundwater · Field questions, explained
Groundwater Is Warming: What the Global Projections Say About Your Well
A guide to scenarios, depth, local temperature records, and the difference between a warm tap and a warming aquifer.
Groundwater is often imagined as a cool, stable reserve protected from the weather above it. That image captures part of its appeal, but it can also make warming research sound surprising or impossible. Heat moves through the subsurface on timescales that differ from a day's air temperature, and the water delivered from a tap has its own route through pumps, pipes, storage, and buildings. Understanding those distinctions is essential before turning a global projection into a claim about one well.
This guide explains how to read groundwater-warming research and plan a useful local temperature record. It does not report original field measurements or determine whether a supply is safe to drink. Temperature can be an important part of water-quality assessment, but it does not replace the chemical and microbiological evidence relevant to a particular system. The aim is to connect an emerging research topic with questions that can actually be investigated.
What the global study contributes
The 2024 Nature Geoscience paper Global groundwater warming due to climate change examines future groundwater temperatures using climate scenarios and depth-dependent modeling. Its significance is the scale of the question: subsurface temperatures may change in ways that deserve attention in water-resource planning. Its outputs are projections under stated assumptions, not a global inspection of every drinking-water well in the publication year.
When reading the study or a news summary, identify the scenario, time horizon, depth, and spatial resolution associated with a claim. A projected condition near the water table is not automatically the projected condition at a deeper screened interval. A population estimate linked to a scenario is not a count of observed illnesses or current household exceedances. Retain those distinctions in a headline, chart caption, and social-media summary. They do not make the research less important; they make clear which planning questions it can reasonably inform.
A warm tap does not locate the source of heat
Suppose a household notices warmer water during a hot period. The observation is real, but its cause remains open. Water can gain heat in storage, building pipework, exposed service lines, or other parts of the system. A sample at the kitchen sink may therefore say more about local plumbing conditions than the temperature at depth in the aquifer.
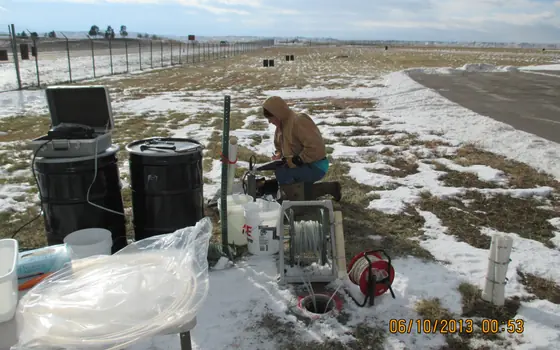
A useful investigation identifies the measurement point precisely. Distinguish groundwater in an observation well, water emerging from a production well, water after storage, and water at a household fixture. Ask a qualified operator or professional how a representative measurement should be obtained without creating safety or system-integrity problems. Do not open equipment or enter a confined space to chase a temperature reading. The first analytical task is to locate the observation within the water-supply pathway. Only then can it be compared meaningfully with research about groundwater itself.
Depth and time create a different climate signal
Subsurface temperature changes do not have to mirror the rapid fluctuations people experience at the surface. Depth, material properties, groundwater movement, and the history of surface conditions influence the pattern. A short record collected during one warm season cannot establish a long-term aquifer trend simply because the calendar year was globally warm.
For local monitoring, record well construction, measurement depth, instrument information, and the exact procedure. Repeat observations in a consistent way. If the sensor position changes, mark that change rather than silently continuing the series. If a well is pumped before measurement, document the operating context according to the project protocol. The central question is whether observations represent comparable conditions over time. A consistent record can reveal a useful pattern, while an inconsistent record may mainly reflect changing methods. Both should be described honestly so that later users do not mistake procedural differences for climate effects.
Temperature is a context variable, not a universal verdict
Temperature can influence physical, chemical, and biological processes, but the consequences depend on the system. It is not sound to label all warmer groundwater unsafe or all cool groundwater suitable for drinking. A temperature observation belongs alongside the other measurements and conditions relevant to the water supply, with interpretation from qualified specialists where needed.
If an article claims that warming necessarily causes a specific contaminant increase, look for evidence linking the mechanism to the aquifer and conditions discussed. Ask whether the statement is based on a controlled experiment, field observations, a model, or an extrapolation. Each can contribute knowledge, but they have different limits. A planning study may identify a possible concern that warrants monitoring without predicting the exact chemical response at every site. Keeping the mechanism and evidence type visible prevents a useful research finding from becoming a blanket statement that local data cannot support.
Build a baseline before describing an acceleration
A baseline is more than the first number in a spreadsheet. It is a documented set of observations collected under sufficiently comparable conditions to support future comparison. Define the purpose, period, locations, and quality checks. Decide whether the project aims to characterize seasonal variation, compare depths, evaluate a specific heat source, or examine a longer-term trend.
For a hypothetical project, a temperature dataset might include sensor identifier, calibration or verification record, well identifier, depth, timestamp, method, pumping status, and field notes. This is an example of useful metadata, not a complete protocol. A qualified project lead should adapt the design to the actual question. Keep original data and any corrections separately. If instrument drift is suspected, investigate it before announcing a warming trend. Baseline documentation is less dramatic than a colored map, but it determines whether the map can later be interpreted as environmental evidence rather than a collection of incompatible readings.
Compare models with observations carefully
A model result and a field measurement may describe different spatial and temporal scales. A model grid cell can represent a broad area, while a sensor describes a particular location and depth. A yearly or multi-year average should not be compared directly with a single afternoon reading as though they were equivalent quantities.
Before evaluating agreement, align the definitions as far as possible and state the remaining mismatch. Identify the model version, scenario, time period, and output depth. Explain how observations were selected and summarized. If a measured value differs from a projection, consider local conditions and measurement uncertainty rather than immediately declaring the entire model correct or incorrect. A good comparison can identify where more detailed local modeling is needed. It can also show that a broad projection is informative for regional planning while remaining unsuitable as a prediction for an individual well without further work.
Urban heat deserves a source investigation
Urban settings can have complex subsurface heat conditions associated with buildings, infrastructure, and land cover. A local warm zone should therefore be investigated in its actual setting. Attributing it entirely to global climate change without examining local influences may miss a more immediate management question. Conversely, finding a local influence does not remove the relevance of longer-term climate trends.
Assemble a conceptual map showing measurement locations, depths, known infrastructure, and the boundaries of the available evidence. Treat infrastructure information carefully where access or security restrictions apply. Avoid implying that proximity alone proves a causal connection. A specialist investigation may need additional measurements or modeling to distinguish potential sources and pathways. The public summary should explain what was observed and what remains a hypothesis. This allows practical discussions about planning and monitoring to proceed without converting a plausible explanation into an established finding before it has been tested.
Turn projections into decisions with review points
Water managers can use warming research to ask whether current monitoring captures temperature consistently, whether infrastructure assessments consider changing conditions, and whether future studies need more depth-specific data. These are useful planning questions even when the exact local temperature trajectory remains uncertain. A scenario is most valuable when it informs a decision whose assumptions can be revisited.
For each proposed action, write down the evidence supporting it, the time horizon, the responsible organization, and the observations that would trigger a review. Avoid treating a distant-year projection as a precise operational forecast for next summer. Consider uncertainty in climate pathways, local groundwater movement, and system conditions. A robust plan can identify actions that improve information quality across several plausible futures. Such actions might be modest, but they are concrete: consistent measurement, better records, clearer source identification, and a commitment to evaluate new evidence rather than defending an early prediction indefinitely.
Report the warming story without inflating it
A compelling article can explain why groundwater temperature matters while admitting what has not been measured locally. Use captions that distinguish observed temperatures from projected changes. State whether a graphic concerns a specific depth, a modeled area, or a particular emissions scenario. Do not pair a warm-water photograph with a claim that the pictured source has been tested unless that evidence exists.
For a household reader, the practical question is whether a local water-quality concern has been assessed with the right measurements and professional advice. For a researcher or manager, the question is whether the monitoring design can distinguish temperature change from procedural and infrastructure effects. Both benefit from the same discipline: match the claim to the observation. Groundwater-warming research deserves attention because it expands the questions water planning must consider. It deserves careful communication for the same reason, so that its findings lead to better evidence and decisions rather than a misleading shortcut from a global model to one person's tap.
Make the temperature unit explicit in every data export and chart. If records are converted between Celsius and Fahrenheit, retain the originals and document the formula. Check timestamp conventions too, especially when instruments and field notes use different time zones. These ordinary details can create apparent discrepancies that have nothing to do with subsurface processes. Resolving them early allows a technical discussion to focus on the physical questions rather than a preventable mismatch in units or timing.
Methodology, sources, and limitations
Method: Desk-based explanation using the primary sources below, checked on November 14, 2026. Examples and workflows are hypothetical unless explicitly attributed. No original field campaign, laboratory analysis, interviews, or independent expert review are claimed.
Scope: A guide to scenarios, depth, local temperature records, and the difference between a warm tap and a warming aquifer. Findings apply only within each source’s stated setting, methods, and date. This guide does not certify a supply, diagnose exposure, or replace a qualified local assessment.
Read our editorial standards and correction and contact status. Review date: .