Data and models · Field questions, explained
Can AI Tell Whether Your Well Is Safe? Read This Before Trusting a Map
Prediction targets, training data, validation, calibration, and uncertainty determine what a groundwater AI map can responsibly support.
An artificial-intelligence map can make groundwater appear unusually legible. Colors divide a complicated subsurface into areas of higher and lower predicted concern, and a search box may place a home directly over one of those colors. That convenience creates a risk: the interface can feel more precise than the evidence behind it. A prediction is useful when its target, training data, validation, and uncertainty remain visible. It becomes misleading when a map cell is presented as a laboratory result for an untested well.
This guide offers a practical reading method for machine-learning groundwater maps. It uses hypothetical examples and does not evaluate a commercial product or report new model performance. The focus is on the questions a resident, journalist, or manager should ask before using a prediction to support a decision. The same questions apply whether the model is called AI, machine learning, statistical mapping, or a decision-support tool.
Identify exactly what the model predicts
A map may predict a concentration, the probability of exceeding a specified threshold, or the likelihood of detecting a substance. Those outputs are different. A probability of exceedance is not a measured concentration, and the threshold is part of the model's definition. If the threshold changes, the prediction target changes too. A label saying only “groundwater risk” is not sufficiently informative.
Read the methods and legend before interpreting the colors. Record the contaminant, threshold if any, unit, geographic domain, depth, time context, and output type. Ask whether the mapped value describes untreated groundwater or another stage in the supply system. A result about source water does not automatically describe a treated tap. If the documentation does not identify the prediction target clearly, do not use the map for a precise public claim. The first quality check is conceptual clarity, not whether the interface looks modern or the algorithm has a fashionable name.
Training data define what the model has seen
Machine-learning models learn relationships from observations supplied during development. If certain aquifers, well depths, land uses, or regions are poorly represented, the model may have less relevant evidence for those settings. A large sample count does not automatically solve this problem when many samples cluster in a few well-studied areas.
Look for a description of well selection and the distribution of observations. Were domestic wells and public-supply wells combined? Were multiple samples from the same well treated as independent observations? Were nondetects and changing laboratory methods handled explicitly? These questions affect what the model can learn. A transparent dataset description should show gaps as well as coverage. It should also explain why available samples are relevant to the intended users. A model trained on one type of supply may provide a helpful regional signal while still needing additional evaluation before it is applied to a different type of well.
Depth is not an optional footnote
Groundwater chemistry can vary with depth and aquifer setting. A map that predicts conditions at a specified supply depth cannot be assumed to represent every screened interval beneath the same surface location. Some models produce separate depth surfaces, while others rely on the depth distribution of the sampled wells. Readers need to know which approach was used.
The primary study Machine-Learning Predictions of High Arsenic and High Manganese at Drinking Water Depths of the Glacial Aquifer System illustrates why both contaminant and drinking-water depth belong in the prediction description. Its regional and geological domain matters. Do not transfer a result developed for a particular aquifer system to unrelated bedrock or another continent merely because the variables have familiar names. A model's documentation should identify where it was designed to operate and where the developers advise caution. Outside that domain, a colorful result can be an extrapolation rather than a well-supported local prediction.
Validation must resemble the intended use
A model can appear accurate if its evaluation data are too similar to its training data. For spatial applications, nearby wells may share conditions, and repeated observations from the same location can create additional dependence. The important question is not simply whether a test dataset existed, but whether the evaluation provides a realistic challenge for the intended prediction task.
Ask how training and evaluation observations were separated. Were geographic regions held out? Were wells, rather than individual sample rows, kept together when appropriate? Was performance checked across different aquifers, depths, or sampling periods? No single validation strategy answers every question, so the choice should be explained. A responsible report gives the evaluation design alongside the performance metrics. An impressive overall score without that context is difficult to interpret. For a public map, readers should also be told whether validation supports local decision-making or only broader prioritization of future sampling.
A probability needs calibration, not just ranking
Imagine a hypothetical model assigning a 70 percent exceedance probability to many comparable locations. Calibration asks whether roughly that share of suitable, independently evaluated cases actually exceed the defined threshold. This example explains the concept; it is not a performance result from any groundwater model. A model can rank higher-concern locations usefully while its numerical probabilities still need evaluation.
Different metrics describe different aspects of performance. A ranking metric does not by itself establish that a displayed probability is numerically reliable. An overall accuracy can also be uninformative when one outcome is much more common than another. Ask for evidence appropriate to the output, including uncertainty and performance across relevant subgroups or settings. If the map provides categories such as low, medium, and high, ask how those categories were chosen and whether they reflect a decision framework or merely convenient colors. The legend should explain the interpretation rather than asking users to infer it from visual emphasis.
Predictor importance is not a causal explanation
A model may identify land use, geology, climate, or other variables as important predictors. That finding describes how the model used available information. It does not automatically establish that changing one variable would cause a corresponding chemical change at a particular well. Correlated predictors, incomplete measurements, and shared spatial patterns can complicate causal interpretation.
When a report moves from prediction to management, look for a separate conceptual and evidential argument. A variable can be useful for identifying where to sample without being a direct intervention target. For example, a geographic association may help prioritize testing but not establish responsibility for contamination. Avoid using an importance chart to blame a nearby activity or promise that a land-use change will immediately improve a well. The model can contribute evidence, but causal claims require appropriate study design and hydrogeological reasoning beyond a list of variables ranked by an algorithm.
Uncertainty should travel with the map
If a map is copied into a presentation, its uncertainty information often disappears first. That is precisely when it is most needed. A screenshot should retain the legend, prediction definition, date, source, and any important limitations. If the original includes intervals, data-density indicators, or out-of-domain warnings, do not crop them away to make the image cleaner.
For interactive tools, users should be able to discover whether a location lies in a poorly sampled setting. A precise coordinate does not guarantee a precise prediction. If a model provides no quantitative uncertainty, say so instead of implying that each cell is equally reliable. A useful communication can combine the modeled pattern with observed sampling locations and a separate explanation of evidence gaps. Those layers help people distinguish where the map summarizes substantial local information and where it mainly expresses a broader learned relationship that needs field verification.
Use the model to design better sampling
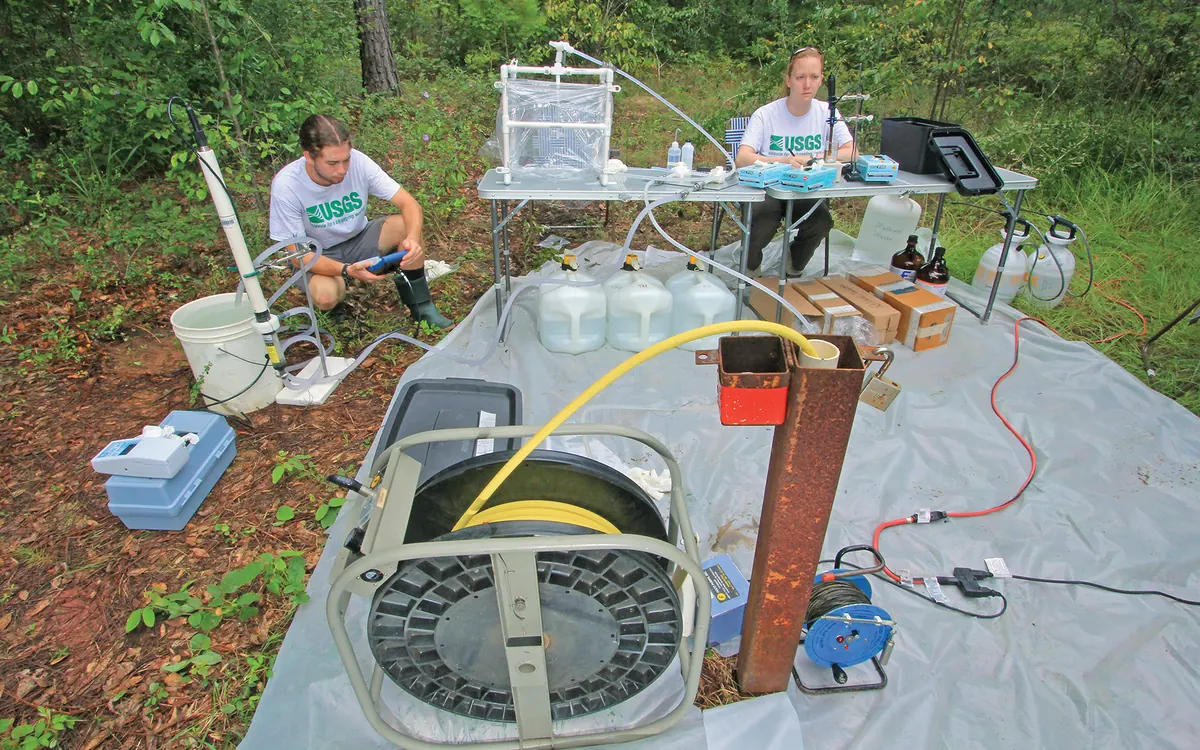
One constructive use of prediction is to decide where additional observations would be informative. A monitoring plan might include higher predicted concern, lower predicted concern, poorly sampled settings, and locations where models disagree. The exact design depends on the purpose and should be developed with qualified specialists. Sampling only the places predicted to be high can produce a biased impression of overall occurrence.
Define the evaluation question before collecting the new data. Is the objective to check a local prediction, estimate regional prevalence, identify overlooked settings, or guide a household's testing? These objectives require different designs. Keep new validation data distinct from training data until the evaluation is complete, and document any later model update. The value of AI is not that it eliminates fieldwork. It can make fieldwork more purposeful by showing where existing evidence is thin, where uncertainty matters to a decision, and where a carefully chosen measurement could change the interpretation.
The final claim belongs to the evidence
The USGS arsenic modeling data documentation provides an example of threshold-based probability mapping with associated uncertainty. Such resources should be read through their definitions, not only their visual output. A map can support a statement about modeled likelihood while an actual well result supports a statement about a sampled well at a specified time.
Before publishing a conclusion, write one sentence stating exactly what evidence supports it. If that sentence contains “predicted,” keep the word in the headline or nearby summary. If a decision requires a local sample, say so. Record the model version and review date so future readers can recognize an outdated result. Groundwater AI can be valuable without pretending to be omniscient. Its strongest role is to organize incomplete evidence, expose useful questions, and help people obtain the observations needed for decisions that a map alone cannot responsibly make.
Before relying on a downloaded map, check whether the original tool has been updated or withdrawn. Save the documentation with the version used in your analysis. A later model can change because its data, methods, or prediction target changed, not because groundwater itself changed overnight. Comparing model editions therefore requires its own review. Preserve earlier interpretations as dated records and explain revisions, so that a new color on a screen does not silently become a claim about a measured environmental change.
Methodology, sources, and limitations
Method: Desk-based explanation using the primary sources below, checked on November 14, 2026. Examples and workflows are hypothetical unless explicitly attributed. No original field campaign, laboratory analysis, interviews, or independent expert review are claimed.
Scope: Prediction targets, training data, validation, calibration, and uncertainty determine what a groundwater AI map can responsibly support. Findings apply only within each source’s stated setting, methods, and date. This guide does not certify a supply, diagnose exposure, or replace a qualified local assessment.
Read our editorial standards and correction and contact status. Review date: .